All guides · Market
German property prices 2015 to 2026: how buying and renting diverged
Updated: 2026-07-12 · Reading time: 9 min · ImmoLens editorial team
Editorial & transparency
This guide was written by the ImmoLens editorial team and last reviewed on 2026-07-12. The information is for orientation and does not replace legal, tax or financial advice.
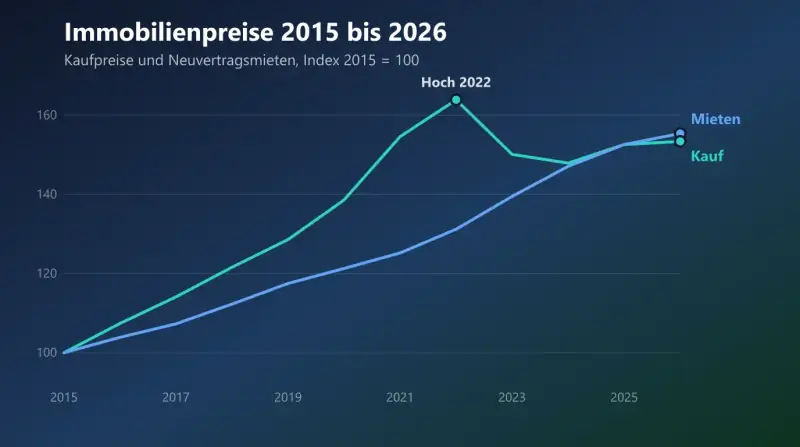
Anyone who has newly rented a flat since 2020 now pays on average around 26 percent more rent. Over the same period, purchase prices have risen by only about 11 percent and are still a good 6 percent below their peak of 2022. Adjusted for inflation, home ownership actually costs less in real terms than in 2020. This article shows the full development from 2015 until today: purchase prices, rents, inflation and mortgage rates, Germany-wide, by property type and for the seven largest cities. All figures come from official statistics and industry association data, the sources are listed at the end.
1. The figures from 2015 to 2026 at a glance
Annual change in percent. Purchase prices: Destatis house price index (transaction prices). Rents: vdp index for new-contract rents. Mortgage rate: effective interest rate on new business, fixed-rate period of more than 10 years (Bundesbank), annual average.
| Year | Purchase prices | New-contract rents | Inflation | Mortgage rate |
|---|---|---|---|---|
| 2015 | +4.8 % | +3.8 % | +0.5 % | 2.0 % |
| 2016 | +7.4 % | +3.9 % | +0.5 % | 1.8 % |
| 2017 | +6.2 % | +3.3 % | +1.5 % | 1.9 % |
| 2018 | +6.6 % | +4.6 % | +1.8 % | 2.0 % |
| 2019 | +5.8 % | +4.6 % | +1.4 % | 1.5 % |
| 2020 | +7.7 % | +3.2 % | +0.5 % | 1.2 % |
| 2021 | +11.6 % | +3.2 % | +3.1 % | 1.3 % |
| 2022 | +6.0 % | +4.8 % | +6.9 % | 2.7 % |
| 2023 | −8.4 % | +6.3 % | +5.9 % | 3.8 % |
| 2024 | −1.5 % | +5.5 % | +2.2 % | 3.6 % |
| 2025 | +3.2 % | +3.7 % | +2.2 % | 3.7 % |
| Q1 2026 | +1.4 % | +3.0 % | approx. +2 % | 3.9 % |
2. Four phases in ten years
Phase 1: The zero-interest boom (2015 to 2021)
Mortgage rates between 1 and 2 percent made loans cheaper than ever. Purchase prices rose for seven years in a row by 5 to 12 percent annually, considerably faster than rents. Property became more and more expensive relative to rent, and critics spoke of an overvaluation.
Phase 2: The interest rate shock (2022 to 2023)
Within 18 months the mortgage rate tripled, and at the peak in October 2023 more than 4.2 percent was being charged according to Interhyp. The consequence: in 2023 purchase prices fell by 8.4 percent, the sharpest decline since the official time series began. Anyone who needed financing could afford less house than before despite the lower prices.
Phase 3: Finding the floor (2024)
Prices fell only slightly (minus 1.5 percent) and the number of sales picked up again. At the same time rents accelerated: in 2023 and 2024 new-contract rents rose by 6.3 and 5.5 percent, more strongly than at any time in decades.
Phase 4: The moderate recovery (since 2025)
In 2025 purchase prices rose again by 3.2 percent, and at the start of 2026 the trend continues in weakened form (Q1 2026: plus 1.4 percent against the same quarter of the previous year, provisional). The mortgage rate has been oscillating between 3.5 and 4 percent for three years. The era of cheap money is over, but so is the market's paralysis.
3. The gap since 2020: rents keep running
For the buy-or-rent question, what matters is less the decade than the time since 2020, and here the calculation has quietly shifted: rents have not seen a single dip, while purchase prices have a complete correction behind them. On top of that comes inflation: consumer prices have risen since 2020 by around 22 percent, purchase prices by only 11 percent. In real terms, home ownership today therefore costs about 9 percent less than in 2020, while new tenants pay more year after year.
For landlords this gap is the core of the investment case: rental income keeps climbing while purchase prices are still below their 2022 peak. How to assess yield, taxes and risks before buying to let is covered in the guide on property as an investment in Germany.
4. House or flat: which has held up better?
The vdp reports purchase prices for owner-occupied residential property separately. Since 2015, single-family homes have become around 68 percent more expensive, owner-occupied flats around 62 percent. In the 2023 correction, flats lost somewhat more (minus 4.9 against minus 3.9 percent), but in the recovery since 2025 they have been gaining faster (plus 3.1 against plus 2.4 percent). Worth knowing: a reliable rent series for houses does not exist in Germany, rent indices always refer to flats in multi-family buildings.
5. The top 7 cities compared
The national trend hides enormous regional differences. The vdp city indices show the development since 2015 (purchase prices for owner-occupied residential property and new-contract rents, in each case up to the start of 2026):
| City | Purchase prices since 2015 | New-contract rents since 2015 |
|---|---|---|
| Berlin | +92 % | +74 % |
| Cologne | +69 % | +52 % |
| Hamburg | +63 % | +53 % |
| Frankfurt am Main | +59 % | +45 % |
| Düsseldorf | +59 % | +48 % |
| Munich | +58 % | +53 % |
| Stuttgart | +55 % | +42 % |
Striking: with plus 92 percent on purchase prices and plus 74 percent on rents, Berlin has decoupled completely from the rest. Among the top 7, Stuttgart is the city with the mildest increase, both for buying and for renting. And in all seven cities the same pattern applies as nationally: purchase prices are below their peak of 2022, rents are at an all-time high.
6. What does this mean for buyers in 2026?
Three sober conclusions from ten years of data:
- The timing argument has turned around. In 2021 many people bought at record levels at 1 percent interest. Today prices are cheaper in real terms, but money again costs almost 4 percent. What matters is the overall calculation, not the headline.
- Waiting does not affect everyone equally. Anyone sitting in a running tenancy agreement is for the time being protected from the rising new-contract rents, because existing rents rise considerably more slowly. Waiting becomes expensive above all for everyone who has to rent anew: after a move, when the family grows, or after a termination for the landlord's own use. And whether purchase prices will keep rising is not settled, the recovery depends on interest rates and the economy. Precisely these uncertainties belong in your personal calculation, not in a blanket rule.
- The individual case beats the index. Between energy class A and H there is a price difference of up to 55 percentage points, and between the regions a factor of two. The market average says little about a specific property.
Even more figures, including an interactive chart for switching between Germany, house versus flat and the top 7 cities as well as a regional comparison by postcode, can be found in our Marktcheck 2026. And what a square metre currently costs in your city is shown by our overview pages property prices by region for 52 German cities and regions.
7. Sources and methodology
Purchase prices Germany: Destatis house price index (transaction prices, annual averages; the value for Q1 2026 is provisional). New-contract rents, the house/flat split and the city comparison: vdp property price index (transaction data of the Pfandbrief banks, official time series, as of May 2026). Inflation: Destatis consumer price index. Mortgage rates: Deutsche Bundesbank, MFI interest rate statistics (effective interest rate on new business for housing loans, fixed-rate period of more than 10 years). Multi-year comparisons are chained from the annual rates of change and rounded. New-contract rents reflect newly concluded contracts; existing rents rose considerably more slowly.
The next step for your property
Check your listing for free with AI: renovation costs, funding programmes and risks in a few minutes. Start your analysis, or use the free tools: Closing cost calculator, Budget calculator, Viewing checklist.